
Economic and Community Profile
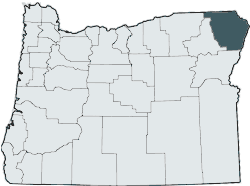
Wallowa County, Oregon
2008 Economic & Community Profile
Population
Wallowa County Land Area:
3,153 square miles
| Population | 2000 | 2004 | 2006 | 2008 | 2010 |
|---|---|---|---|---|---|
| Enterprise | 1,895 | 1,940 | 1,945 | 1,975 | 1,975 |
| Joseph | 1,055 | 1,080 | 1,095 | 1,105 | 1,125 |
| Lostine | 265 | 250 | 250 | 250 | 250 |
| Wallowa | 870 | 870 | 870 | 890 | 890 |
| Unincorporated | 3,165 | 3,010 | 2,980 | 2,895 | 2,845 |
| Totals: | |||||
| Wallowa County | 7,250 | 7,150 | 7,140 | 7,115 | 7,085 |
Estimated Driving Times and Distances:
Time & Mileage to Wallowa County (Enterprise)
| Starting at: | Miles | Hours | Starting at: | Miles | Hours |
|---|---|---|---|---|---|
| Astoria, Oregon | 425 | 8 hours | Boise, Idaho | 234 | 5 hours |
| Baker City, Oregon | 107 | 2 hours, 30 minutes | Denver, Colorado | 1061 | 18 hours |
| Bend, Oregon | 336 | 7 hours 15 minutes | Lewiston, Idaho | 87 | 2 hours 15 minutes |
| Eugene, Oregon | 426 | 8 hours | Phoenix, Arizona | 1276 | 24 hours |
| La Grande, Oregon | 65 | 1 hour 45 minutes | Reno, Nevada | 601 | 13 hours |
| Medford, Oregon | 558 | 10 hours 30 minutes | San Francisco, California | 818 | 16 hours 30 minutes |
| Pendleton, Oregon | 115 | 2 hours 30 minutes | Seattle, Washington | 397 | 7 hours 30 minutes |
| Portland, Oregon | 324 | 6 hours 15 minutes | Spokane, Washington | 191 | 5 hours 30 minutes |
| Salem, Oregon | 371 | 7 hours 15 minutes | Pasco, Washington | 148 | 4 hours 30 minutes |
Wallowa County Climate
A mountain range encircles the more populated centers of the county; protecting the valleys from severe weather impacts of regional storms. Summers are warm and pleasant. Extreme temperatures in the high 90°-100°’s are typical for short periods in late July and August. The major portion of precipitation emerges in late spring and fall. Light snow can be expected in the valleys by late November and recurs periodically until April. Brief heavy snow may occur in the valleys from November to February. Generally, heavy snow occurs at the higher elevations; which produce snow packs that often remain year around on high mountain peaks of the Eagle Cap Wilderness.
Source: George Taylor, State Climatologists & Cadd Hale & Sarah Joos, Publication Assistants
| Joseph Sta. | Jan | Feb | Mar | Apr | May | Jun | Jul | Aug | Sept | Oct | Nov | Dec |
|---|---|---|---|---|---|---|---|---|---|---|---|---|
| Normal Monthly Maximum Temp | 37 | 40 | 46 | 53 | 60 | 67 | 79 | 80 | 69 | 57 | 44 | 35 |
| Normal Monthly Minimum Temp | 18 | 20 | 24 | 29 | 36 | 42 | 47 | 46 | 40 | 31 | 25 | 17 |
| Extreme Monthly High Temp | 57 | 59 | 69 | 76 | 82 | 87 | 95 | 94 | 94 | 82 | 70 | 54 |
| Extreme Monthly Low Temp | -22 | -25 | 2 | 11 | 18 | 26 | 31 | 33 | 20 | 11 | 7 | -17 |
| Normal Precipitation Totals | 1.16 | .97 | 1.31 | 1.59 | 2.71 | 1.64 | 1.29 | .74 | 1.68 | 1.37 | 1.56 | 1.03 |
| Avg. Ground Snow Depth | 2.6 | 2.6 | 1.3 | .3 | - | - | - | - | - | - | .4 | .7 |
| Extreme Ground Snow Depth | 18 | 11 | 10 | 6 | 2 | - | - | - | - | 3 | 6 | 7 |
| Normal Snowfall Totals | 11.5 | 6.1 | 9.5 | 5.5 | .4 | - | - | - | - | 1.5 | 5.6 | 5.8 |
General Demographics
Wallowa County land area in square miles 3,153
Population (2010) 7,085
Population density (persons per square mile) 2.2
Population percent of the State 0.2%
Source: PSU, Population Research Center & Oregon Employment Department
County Age Groups (2010)
Children, Ages 0-17 years 20.3%
Adults, ages 18-64 years 60%
Adults, ages 65+ years 22.2%
Source: PSU, Population Research Center
Community Age Groups (Wallowa County)
| Age Groups | 1970 | 1980 | 1990 | 2000 | 2005-2009* |
|---|---|---|---|---|---|
| Under 5 years of age | 423 | 547 | 473 | 354 | 292 |
| Ages 5-19 years | 1,815 | 1,646 | 1,487 | 1,537 | 1,126 |
| Ages 20-44 years | 1,631 | 2,402 | 2,215 | 1,800 | 1,426 |
| Ages 45-64 years | 1,552 | 1,598 | 1,499 | 2,171 | 2,430 |
| 65+ years | 826 | 1,237 | 1,080 | 1,364 | 1,551 |
| Median Age | 34.8 | 33.5 | 37.6 | 44.4 | 50.3 |
*U.S. Census Bureau American Community Survey estimates
Population Characteristics (2005-2009)
| Population (Total 102.7%, some figures overlap) | |
|---|---|
| White – European population | 96.9% |
| Hispanic population | 2.6 % |
| American Indian/Alaskan Native Population | 1.0% |
| Black American population | 0.02% |
| Asian population | 0.6% |
| Other two or more races | 1.4% |
Income (Per Capita Income)
| 2002 Income Per Capita Income | $25,475 |
| 2004 Income Per Capita Income | $27,960 |
| 2006 Income Per Capita Income | $29,931 |
| 2008 Income Per Capita Income | $32,344 |
| 2008 Median Household Income | $42,559 |
| 2000 Median Household Income | $33,257 |
Source US Census Bureau; Bureau of Economic Analysis
Size of Firm (Private Sector)
| 0-4 employees | 72.3% |
| 5-9 employees | 19.0% |
| 10-19 employees | 6.2% |
| 20-49 employees | 2.5% |
Source: Oregon Employment Department
Number of Employers (2009)
| Wallowa County | Number Entities | Total Payroll | Average Pay |
|---|---|---|---|
| Total of All Industry | 409 | $65,227,253 | $27,615 |
| Total Private | 360 | $39,593,015 | $23,952 |
| Total Government | 49 | $25,634,238 | $36,155 |
Source: Oregon Employment Department
Civilian Labor Force
| Wallowa County | 2000 | 2005 | 2009 | 2010 |
|---|---|---|---|---|
| Total Labor Force | 3,498 | 3,574 | 3,732 | 3,844 |
| Total Employment | 3,234 | 3,306 | 3,292 | 3,381 |
| % of Unemployment | 7.5% | 7.5% | 11.8% | 12.0% |
Source: Oregon Employment Department
Employment
Labor Force by Industry
| Percentage representing labor force | 2010 |
|---|---|
| TOTAL PRIVATE | 68.6% |
| Natural Resources & Mining | 2.5% |
| Construction | 6.4% |
| Manufacturing | 4.7% |
| Trade, Transportation, and Utilities | 16.9% |
| Information | .8% |
| Financial Activities | 7.2% |
| Professional & Business Services | 5.1% |
| Education & Health Services | 9.7% |
| Leisure & Hospitality | 11.0% |
| Other Services | 4.2% |
| GOVERNMENT | 31.8% |
| Federal | 5.1% |
| State | 5.1% |
| Local Government | 21.6% |
Source: Oregon Employment Department
![]() Links to more detailed information about Wallowa County (pdf files)
Links to more detailed information about Wallowa County (pdf files)
US Census Bureau Wallowa County
Personal Incomes Wallowa County
Personal Income and Employment Wallowa County